
| Origin Seminar in Boston - Sept 2014! |
|
OriginLab is offering an Origin seminar on Sept. 26 in Boston, MA. OriginLab technical staff will demonstrate key graphing and analysis features, including Curve Fitting, Peak Analysis, Auto-Recalculation, Themes and Templates for Graphing and Analysis, Custom Reports, Batch Plotting, and Batch Analysis. This is a great opportunity to learn how you can use Origin more effectively. There will be time for discussion - so bring your specific data and questions! More information and a link to register are available here. |
| Case Study |
|
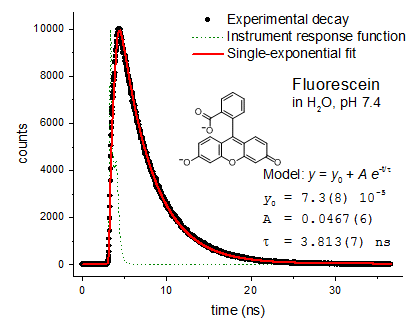
Dr. Marco Bonizzoni, an assistant professor in the Chemistry Department of The University of Alabama, is involved in the investigation of supramolecular chemistry. When Professor Bonizzoni's most recent research required fitting complex experimental data, he found that Origin's non-linear curve fitting feature outperformed other softwares and suited his purpose admirably.
Read the entire article in our Case Studies section. |
| Upcoming Events |
|
Tradeshows OriginLab will be attending these upcoming tradeshows: Automotive Testing Expo 2014, Novi, MI Neuroscience 2014, Washington, DC MRS Fall 2014, Boston, MA |
| Social Media | |||
|
Follow us on Facebook, LinkedIn, and YouTube for technical updates, and to connect with other Origin users:
|


| Contact |
|
Send comments and feedback to: newsletter@originlab.com For more information about OriginLab, visit: www.originlab.com |
| Tools and Resources |
|
Tech Tip Did you know you can change a spectrum's Y offsets by simply dragging the curve? This was a little known feature introduced in Origin 8.1, and can be used after plotting the multiple traces using Plot: Multi Curve: Stacked Lines by Y Offsets. Watch this video or following this tutorial to learn more. Graph of the Month July Winner - Dr. Florencio Garcia-Santamaria! The Graph of the Month winner for July is Dr. Florencio Garcia-Santamaria. Dr. Garcia-Santamaria used the Layout option to arrange his graphs. The lower two graphs are contour plots with projections enabled. Additionally he customized the color palette, meshing and lighting to emphasize certain parts of the plot. 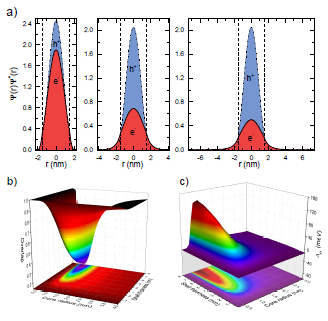
Submit your own graph for a chance at winning! Forum Get your questions answered and engage in discussions with other users on our Forums. You can find more technical resources on our Help Center page. |
| News from You |
|
We want to hear from you. Share your Origin experiences and graphs with us, and your story could be featured on our website or in the next issue of our newsletter. Do you have requests for new features? Send an e-mail to: newsletter@originlab.com |